
🛠️📊 Visual Management Audit with Spider Graph
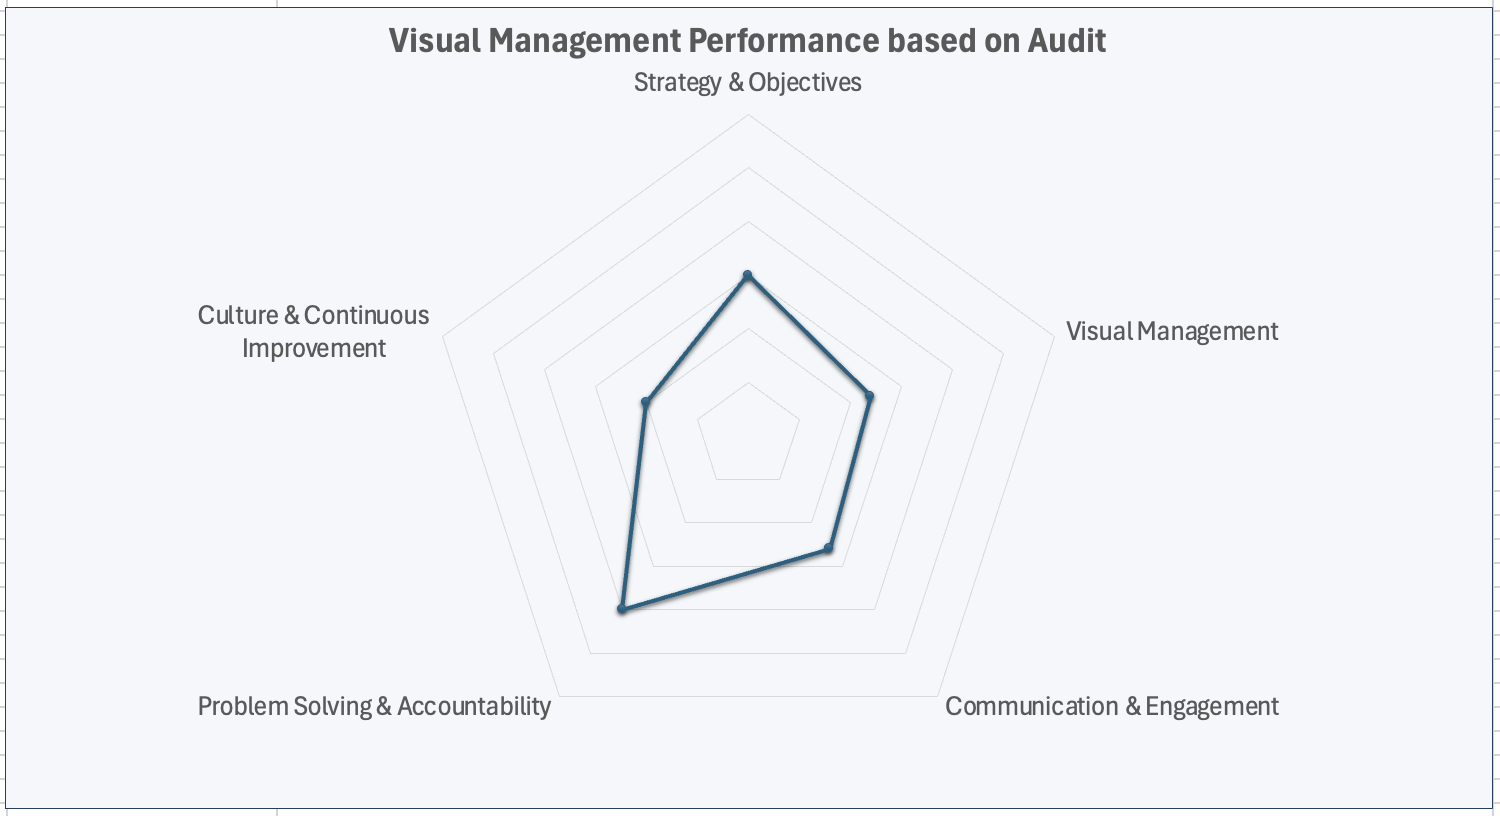
The Visual Management Audit & Performance Results Tool is your go-to Excel-based sidekick for assessing and improving visual management in the workplace. With a structured checklist ✅, easy scoring system 📋, and a visually insightful spider graph 🕸️, you'll get a sharp view of where you're smashing it and where you need to pull up your socks. Perfect for ops managers, lean pros, and business leaders, this tool helps you stay on top of efficiency, accountability, and continuous improvement 🚀. Remember to download immediately as the link to the file only lasts 24 hours. Can’t wait to hear the improvements your team makes with this spreadsheet!
The Visual Management Audit & Performance Results Tool is your go-to Excel-based sidekick for assessing and improving visual management in the workplace. With a structured checklist ✅, easy scoring system 📋, and a visually insightful spider graph 🕸️, you'll get a sharp view of where you're smashing it and where you need to pull up your socks. Perfect for ops managers, lean pros, and business leaders, this tool helps you stay on top of efficiency, accountability, and continuous improvement 🚀. Remember to download immediately as the link to the file only lasts 24 hours. Can’t wait to hear the improvements your team makes with this spreadsheet!
The Visual Management Audit & Performance Results Tool is your go-to Excel-based sidekick for assessing and improving visual management in the workplace. With a structured checklist ✅, easy scoring system 📋, and a visually insightful spider graph 🕸️, you'll get a sharp view of where you're smashing it and where you need to pull up your socks. Perfect for ops managers, lean pros, and business leaders, this tool helps you stay on top of efficiency, accountability, and continuous improvement 🚀. Remember to download immediately as the link to the file only lasts 24 hours. Can’t wait to hear the improvements your team makes with this spreadsheet!